There is that 1974 CIA working paper [1] climate “skeptics” like to brandish when it comes to the “coming ice age” media coverage in the 70s, in order to show that it wasn’t just a media event but scientific consensus back then. One of the favourite passages is this section on page 7:
Early in the 70s a series of adverse climatic anomalies occured:
- The world’s snow and ice cover had increased by at least 10 to 15 percent
The usual suspects either accept it as gospel or even use this passage as refutation of todays data: Steven Goddard, David Archibald at WUWT, Marc Morano at ClimateDepot and Canada Free Press.
When looking at the bibliography of the CIA working paper we find a 1974 paper in Science by Kukla and Kukla [2] that seems to support that claim, as the abstract reads in part:
During the past 7 years the largest changes occurred in the fall and in the continental interiors of Asia and America (8).
Two synoptic parameters which could readily provide information on the development of snow and ice cover in the northern hemisphere are (i) the total area momentarily covered and (ii) the running annual mean of snow and ice coverage for the preceding 1-year period. By 20 September 1973 the annual mean coverage was 37.3 x 10⁶ km2, 11 to 12 percent higher than at the same time during 1968 through 1970. Snow cover-fall, the season when 15 x 106 to 55 x 106 km2 of the northern hemisphere is covered with snow and ice, started on 20 September 1973, compared to 17 September 1972 and 5 or 10 October during 1967 through 1970.
So far, so good? Well, for the CIA working paper, yes. At least they took a paper that was at that time state-of-the-art. Whether or not the CIA working paper gave a fair assessment of the overall state has been discussed elsewhere. For the “skeptics”? Not so much. After all, satellite imaging and its analysis was still in its infancy and there may have been revisions. So let’s simply turn to Google Scholar and look up the title of the Kukla and Kukla paper (one of the easier ways to find the link to the Science paper). Letting your eyes stray over the page you spot:
- [PDF] A discussion of the accuracy of NOAA satellite-derived global seasonal snow cover measurements
A link to the PDF of the article is provided courtesy of rutgers.edu [3]. Nice! And one of the original author co-authors the paper. Good. Concerning the 1974 paper we find:
The quality of the NOAA snow charts has improved with time because of improved sensors, increased interpreter expertise in recognizing snow-covered land from clouds and snow-free land, less frequent changes of the personnel involved in the charting and improved mapping techniques. The early maps have been found to be considerably less reliable, most often underestimating the extent of snow cover. This lack of consistency has been particularly pronounced in autumn as shown in Figure 7 and Table 2. Kukla & Gavin (1984) concluded that the errors in the NOAA charts were largest during the first five years of observation and that, consequently, Kukla & Kukla’s (1974) conclusion on the sharp increase of average annual Northern Hemisphere snow cover between 1970-1972 should be revised. The early (1966-1974) mapping of the Tibetan Plateau region was also determined to have been mapped with varying accuracy (Ropelewski, 1984; Matson et al., 1986).
Trying to get a copy of Kukla & Gavin (1984) [4] proved to be a bit more difficult, but the Library of Congress came to the rescue. A search for the proceedings of workshop containing that paper lead to the Hathi Trust Digital library. [3] got the page numbers wrong but that’s just a minor hick-up. Kukla & Gavin conclude (emphasis added):
We conclude that the snow cover charts for fall, particularly October, are deficient throughout the 1966-1983 period of record, but that the errors were much larger during the first 5 years of observation. The conclusion of Kukla and Kukla (6) on the sharp increase of average annual snow cover in the Northern Hemisphere between 1970 and 1972 was based on unverified charts and needs revisions. Almost half of the reported increase of snow during 1971 took place in Autumn (fig. 8). Because our evaluation shows that the snow charted for 1966 through at least 1969 was seriously under-represented, much of the reported change is actually an artifact of an inaccurate data base.
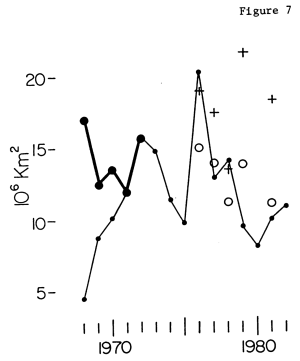
So what went wrong? The short version: low illumination in the snowline zone, dense forests, lack of frozen lakes as foolproof indicators and frequent dense clouds made the assessment of whether or not a patch is covered by snow difficult and resulted in a learning curve. Experience later on showed that earlier estimates had for the most part been too low. The paper includes a figure 7 (displayed below), where the original values (thin line, full dots) are compared to the revised values (heavy line, full circles) of snow extent in Eurasia at the end of October. For more details see the original paper.
 (link)
I’ve stopped looking further at this point.
To summarize: While the CIA working paper reported the increase in snow and ice cover in good faith, it has by now turned out that the “at least 10 to 15 percent” increase was an artifact. To claim that the increase was real from today’s perspective shows the claimer has not done his/her homework properly.
[1]“A Study of Climatological Research as it Pertains to Intelligence Problems”, Office of Research and Development, CIA (August 1974)
[2]Kukla G.J., Kukla, J.H., “Increased Surface Albedo in the Northern Hemisphere
Did satellites warn of the weather troubles of 1972 and 1973?” DOI:10.1126/science.183.4126.709
[3]DR Wiesnet, CF Ropelewski, GJ Kukla and Robinson, “” in Large Scale Effects of Seasonal Snow Cover (Proceedings of the Vancouver Symposium, August 1987). IAHS Publ. no. 166, pp. 291-304
[4]Kukla, G.J. & Gavin, J. (1984) Recent fluctuations of Northern Hemisphere snow cover in autumn. In: Proc. Eighth Annual NOAA Climate Diagnostics Workshop (Downsview, Ontario, Canada, Oct. 1983), 289-296.


 (link)
 (click to enlarge)
 and
and  are “expert guesses”,
  is a scaling parameter and
 parameter will dominate the evolution of species numbers, but let’s have a look. I have assumed a simplistic temperature model: temperature change after 2000 follows an arcus tangens function with an initial slope of 2°C/century and levels off at various
  . Here’s the result.
