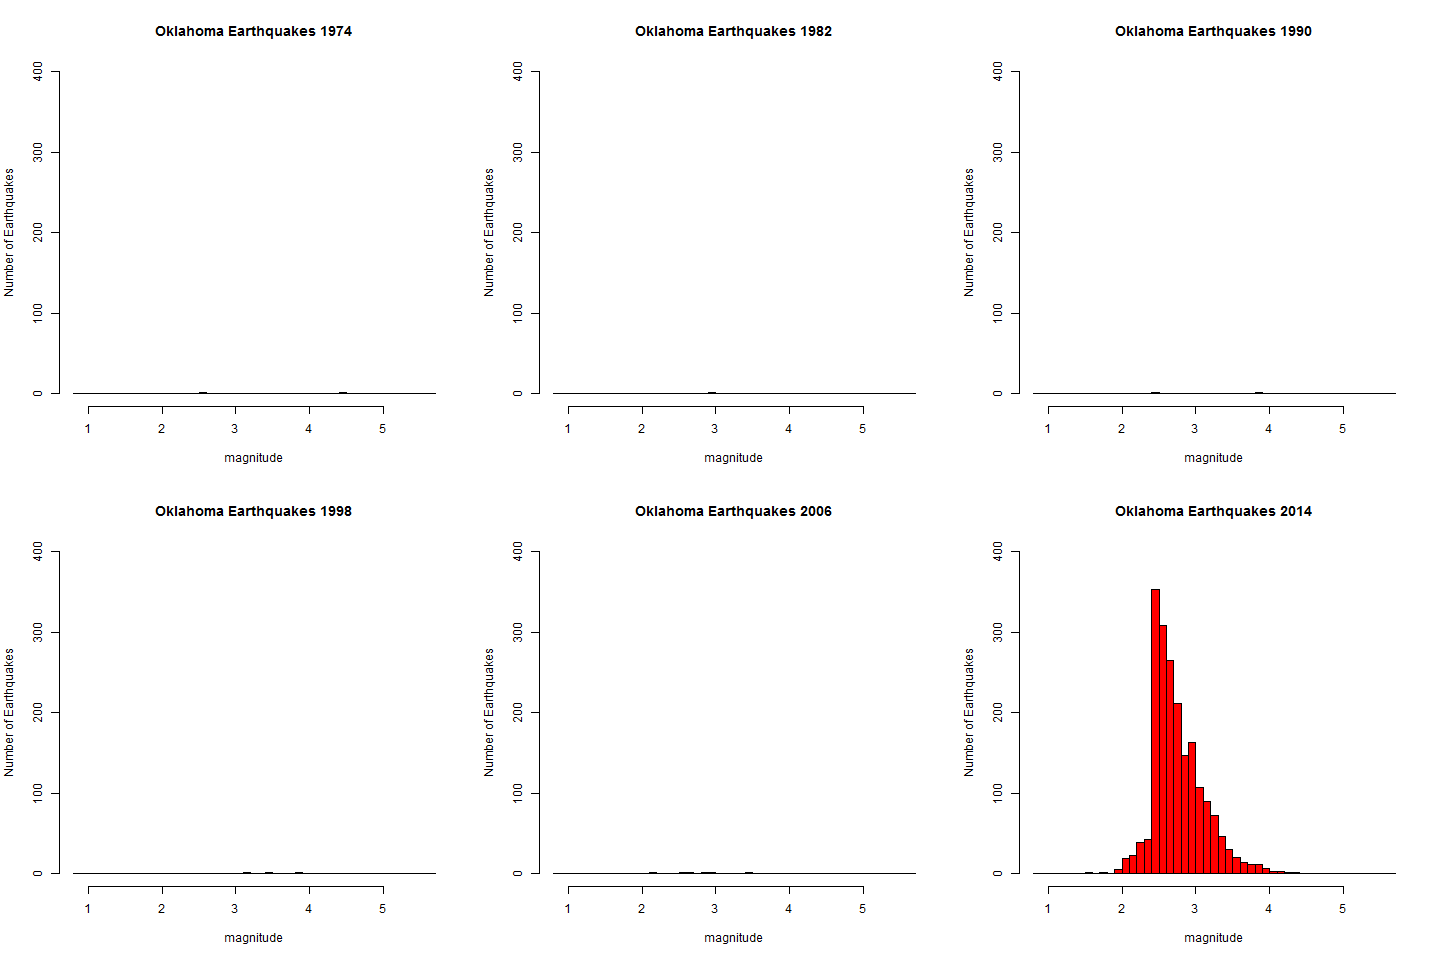
Tamino’s most recent post “Oklahoma: Not OK” covers the change in number of earthquakes per year in Oklahoma in the wake of fracking. It got me interested in the distribution of magnitudes. Here are the results as an animation:
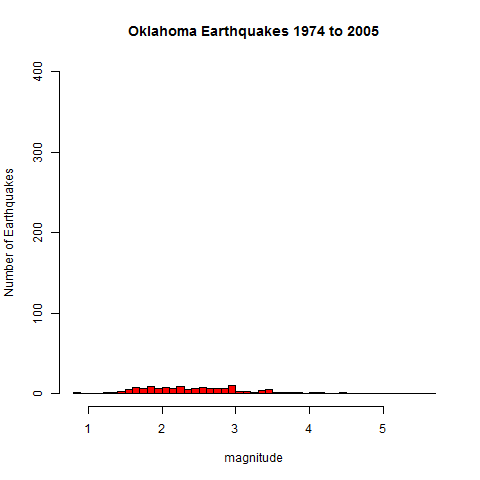
Here are the counts accumulated over the 1974 to 2005 period:
If you want to play around with the data for yourself, here’s the R-script:
if (file.exists("quakes.RData")){

load("quakes.RData")

}else{

url "starttime=1974-01-01",

"endtime=2015-12-31",

"minlatitude=33.211",

"minlongitude=-103.359",

"maxlatitude=37.3",

"maxlongitude=-94.043",

"minmagnitude=0",

collapse = "&")

quakes save(quakes, file = "quakes.RData")

}
oq oq$year rm(quakes)
oqh 0], breaks = seq(0.8,5.7,0.1),

xlab = "magnitude", ylab = "Number of Earthquakes", col = "red", ylim = c(0,400),

main = paste0("Oklahoma Earthquakes ", HistYear))

}
###############################

# Create a series of histograms

for (yy in 1974:2014) {

png(paste0("oq",yy,".png"))

oqh(yy)

dev.off()

}

###############################
There are three events in the 2010 to 2011 period listed with a magnitude of 0, these were ignored in the creation of the histograms.
Caveat:
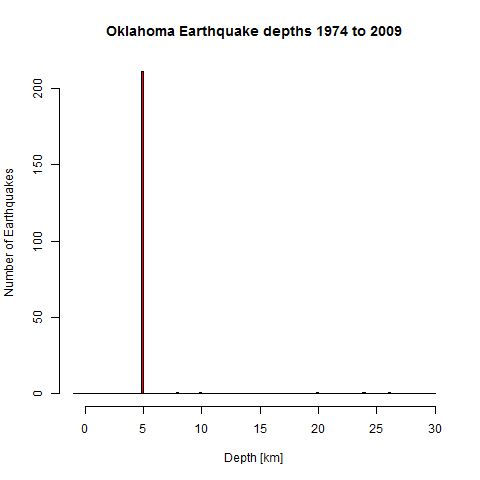
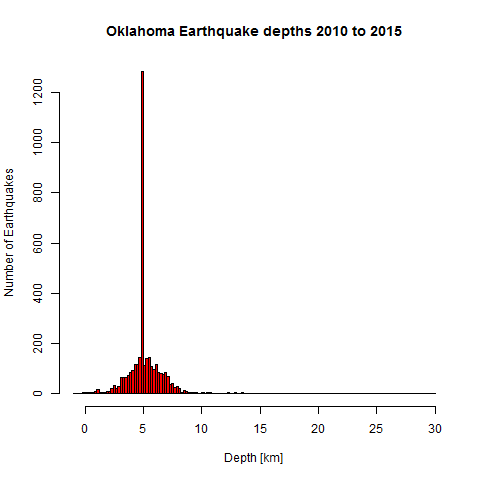
In 2009/2010 a change in instrumentation and/or analysis of the data seems to have taken place. On the one hand a new magnitude type “Ml” is introduced and right away accounts for the majority of analysis, on the other hand several of the other types gain improved depth resolution. It is unclear to me, wether or not this change influences the earthquake count numbers.


